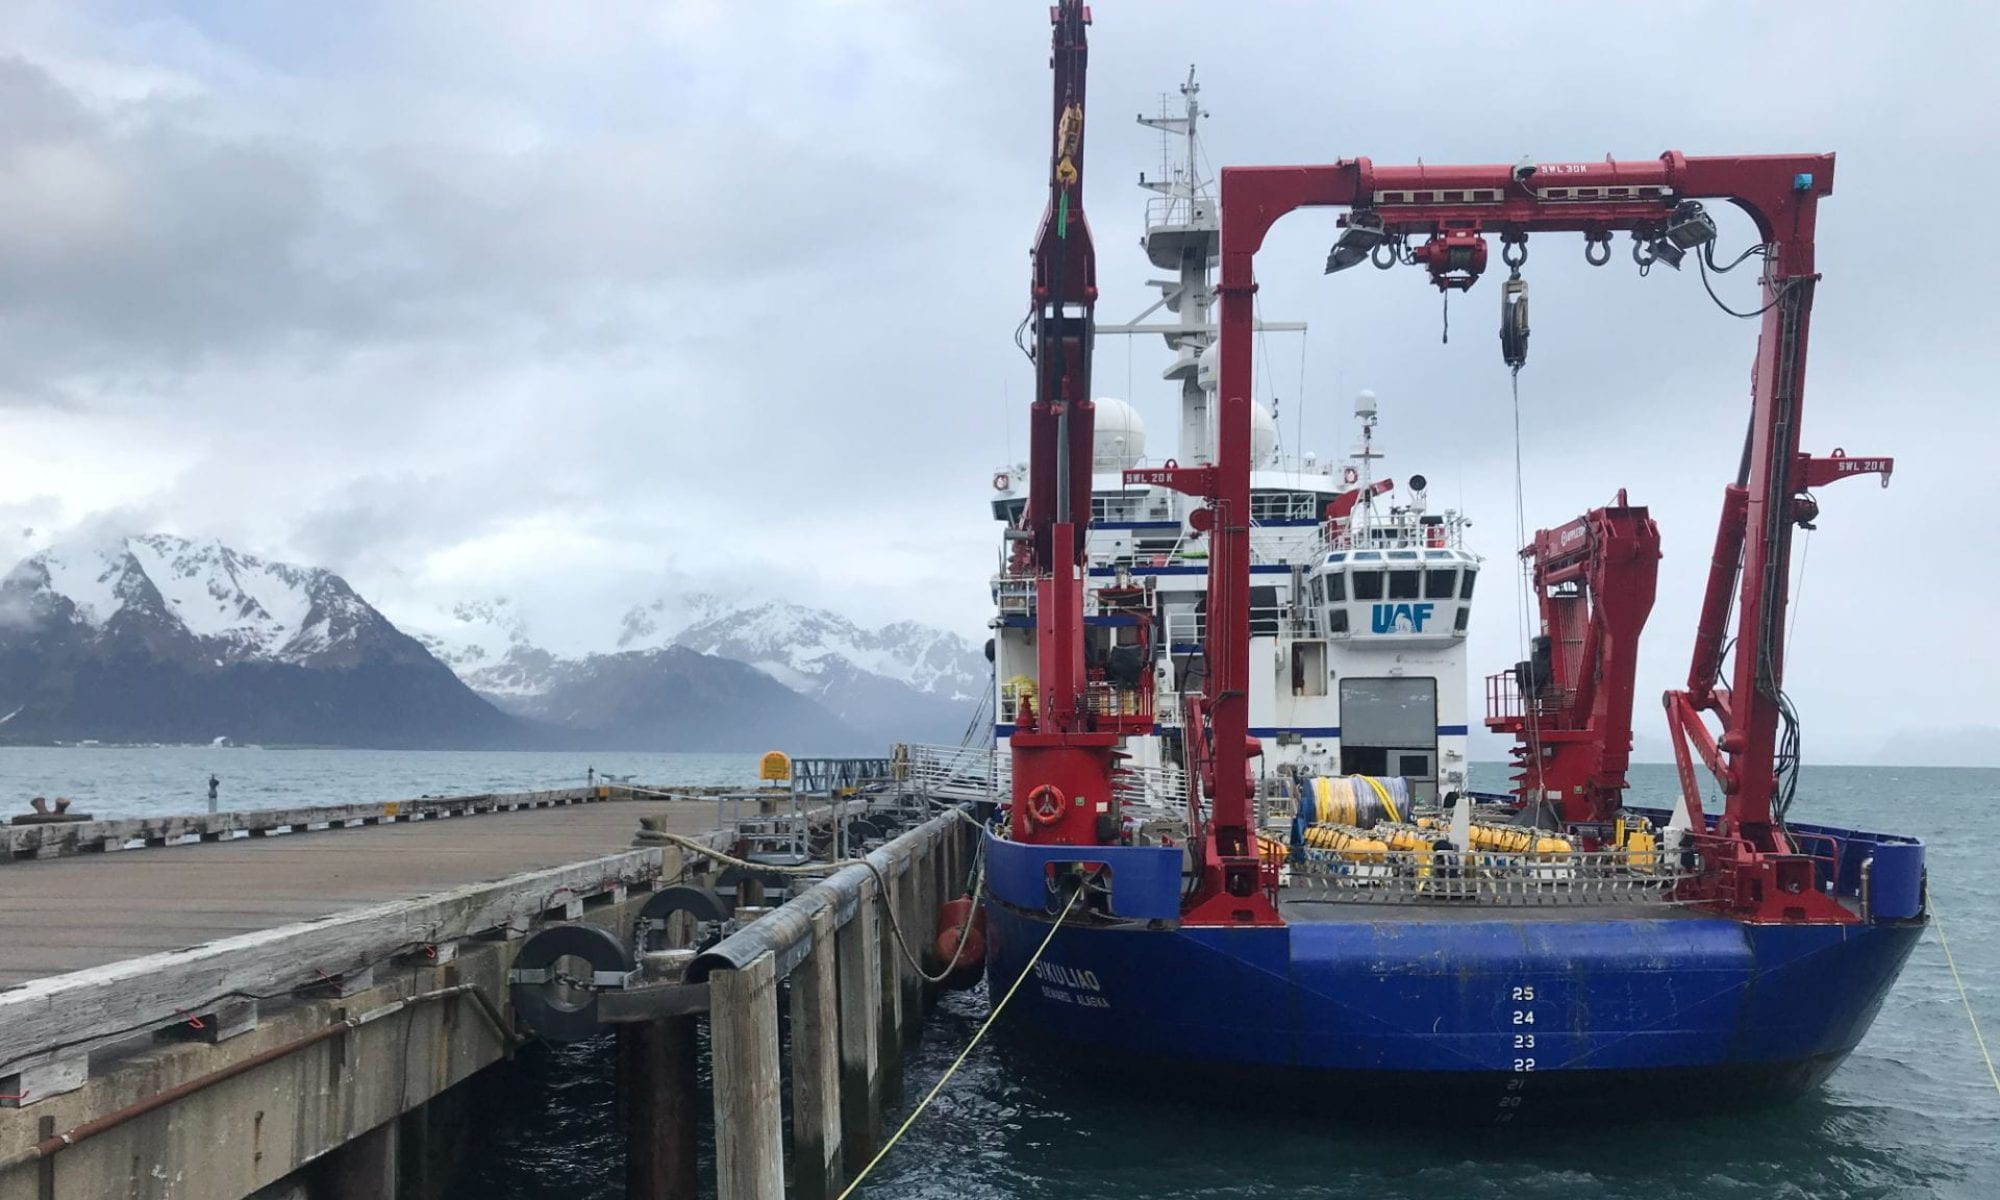
It is now Day 13 of 27, the halfway point on our EPIC voyage. Phase 1 of the project is complete. We spent the last few days successfully recovering all 22 OBEM from the first batch of deployments. The video below shows off an ideal recovery, sped up by 4x. Kudos to Amílcar for a perfect toss of the grappling hook.
With data in hand, I needed a sneak peek of the data quality. So I stayed up an extra few hours last night and did some quick-and-dirty processing to alleviate my anxiety. I am happy to report that most of the time-series have good signal-to-noise ratios and yield high-quality magnetotelluric (MT) transfer functions! Below is a spectrogram showing the MT signal in the time-series. Notice the slightly warmer colors on Oct 18 & 19; this is energy from the geomagnetic storm I mentioned in my previous post!

Just after midnight this morning, we kicked off Phase 2 and resumed deployments. It is now 10 am and we already deployed six more OBEM and one OBS. All this and we are one day ahead of schedule! We have also been quite lucky with smooth seas for the past week (*knocking on wood*). I am extremely grateful to the science party, techs, and crew for all their hard work. At this stage, the science party is a well-oiled machine, all team members certified experts at their craft.
To keep things interesting for the students during long transits in between deployments and recoveries, we have held multiple presentations and training sessions on seismic imaging, MT imaging, and multibeam swath bathymetry mapping. In fact, by the end of this survey, the students will have put their new knowledge to work, processing the multibeam bathymetry data from this cruise as well as reprocessing MT data from a prior project (SERPENT) that inspired EPIC.


